
Sierra Chart Studies · Tested, Not Promised
Auction theory,
priced in bands.
Weekly pivot and extension-band studies for Sierra Chart — with the playbook replayed against 5½ years of real NQ & ES tick data, and the full results published. Including the setups that failed.
How It Works
Four numbers tell you where you are.
Every Auction Pivots study builds off the same weekly framework — no repainting, no discretionary guesswork about "the level."
Weekly Pivot
Calculated fresh each week from the prior week's range — the center of gravity price rotates around.
Extension Targets
Three tiers above and below the pivot band (X1, X2, X3) act as measured targets and stop anchors. Our testing was blunt: they're objectives, not reversal zones.
Open Classification
Where the week opens against the band stack sets its regime — the single condition our backtests found the edge lives in.
The Playbook HUD
A living readout: classifies the week at the open, arms the validated plays with entry, target, and stop, tracks them live, and audits its own hit rate as you trade.
The Research
We tested it. Including the parts that failed.
Roughly forty rules replayed bar-by-bar against 5½ years of real NQ & ES tick data. Five survived. The rest are printed below — because a backtest you never see failing isn't evidence.
Before / After
Same chart. See what the suite adds.
Drag to compare a plain price chart against the same chart with Auction Pivots running — pivot band, extension bands, and swing structure tagged automatically.
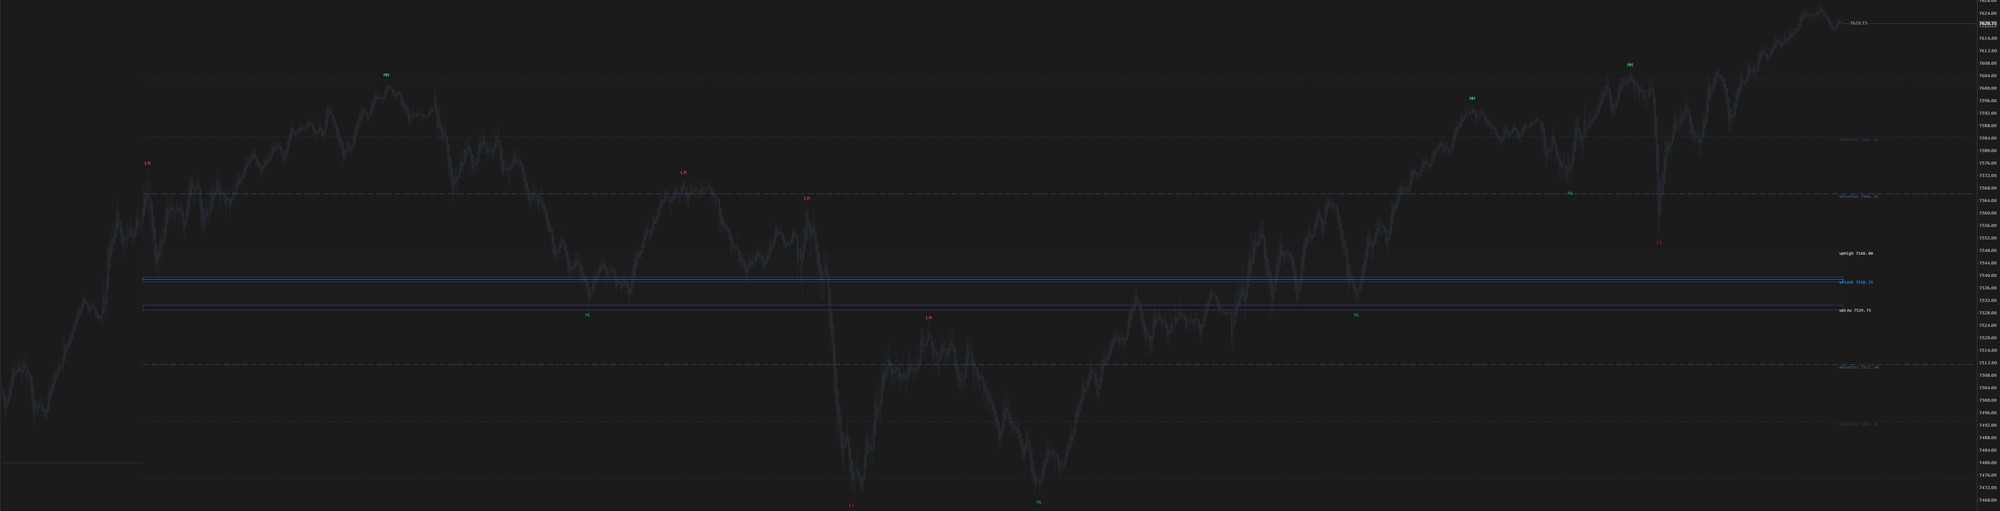 Auction Pivots
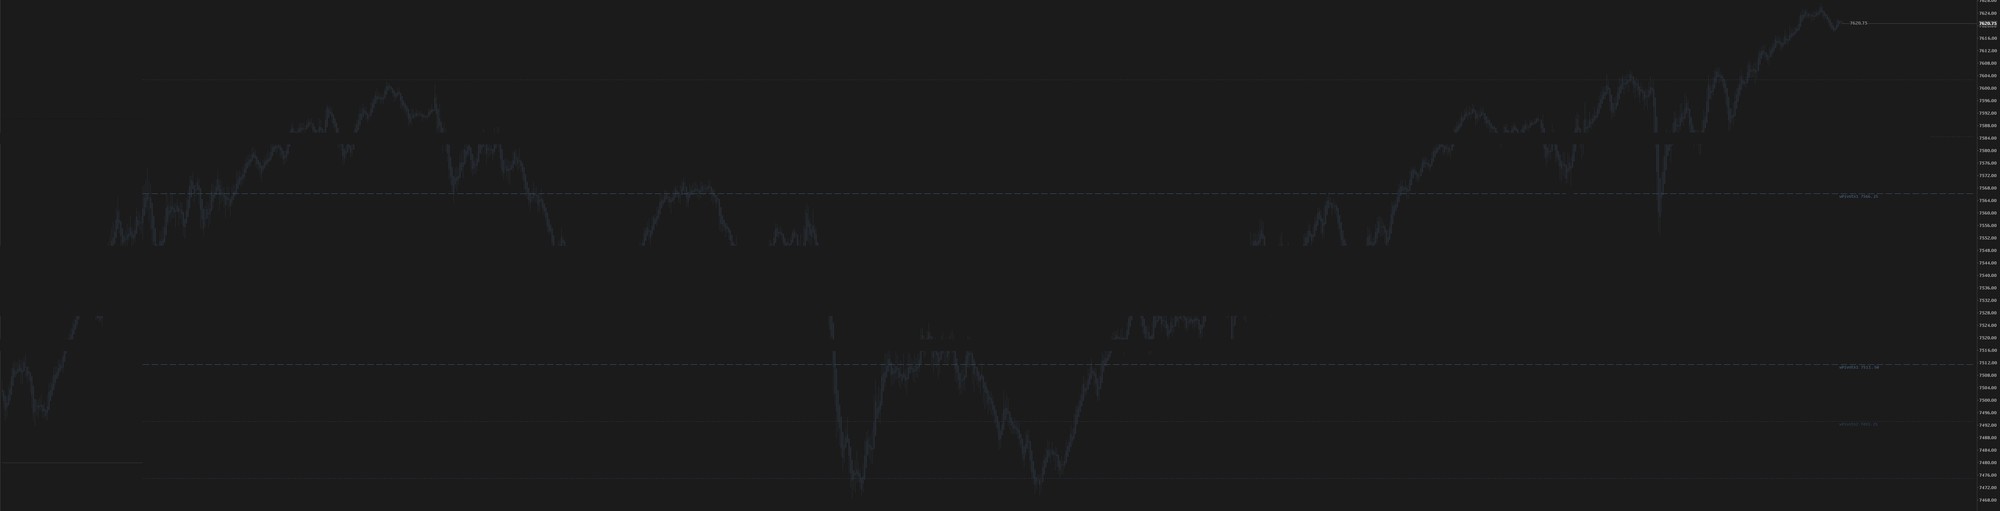 No indicator
See It In Action
Real chart. Real levels. No cuts.
Screen recording of the Full Suite running live on Sierra Chart — the pivot band, extension bands, and swing structure tagging as price actually moves through them.
The Studies
One suite. Every level that matters.
Every subscription includes the full study suite for Sierra Chart, updated automatically, plus chart templates and courses.
Weekly Auction Pivot
- Weekly pivot with high/low band and extension targets
- Health monitor flags SUSPECT weeks (holiday, roll, thin data) before you trust the levels
Living Playbook HUD
- Weekly verdict at the open — validated plays armed with entry, target & stop
- Tracks fills and outcomes live, keeps a rolling win-rate record on your own chart
- Statistical drift alarm warns if the live edge falls below its tested range
Session Delta Stack
- Daily session-stack box with the breakout bracket printed on-chart: entry, target, stop
- Overlay mode — compute on your data chart, trade from your execution chart
Monthly Auction Pivot
- Monthly pivot with band and extension levels for higher-timeframe context
- Historical month dimming
Pricing
Full Suite subscription.
One plan, every study, unlimited machines. Full details are on the studies page.
Billed via Whop · cancel anytime · see Terms & Refund Policy.
Education
Know the theory, not just the indicator.
Short, focused courses that teach the auction-market-theory ideas behind every study — so you're reading the chart, not just following a dot.
Auction Market Theory: Foundations
- Why price rotates around value, not price targets
- Value areas, pivots, and balance vs. imbalance
Trading the Weekly Pivot
- Reading the pivot band and extension bands live
- Where the Auction Pivots studies fit into a session plan
The Mean-Reversion Playbook
- Using the reversion tracker for trade location
- Handling holiday and low-volume weeks
Included With Purchase
Every subscription includes:
Always Up to Date
Every study update is included for as long as you're subscribed.
Discord Support
Direct access to the people building the studies.
Community Access
Trade alongside other Sierra Chart traders using the same framework.
Chart Templates
Official Sierra Chart layouts, pre-built with every study installed.
FAQ
Common questions.
Trade the playbook that survived testing.
Five validated setups, a HUD that keeps score on itself, and the full research — failures included — published above.